
Logs are awesome!
They provide feedback, allow us to view different angles of history, give baselines to identify aberrations, and highlight anomalies. With the growing scale of operation at OpenX, gaining intelligence from them ceased to be a manual task long ago when we adopted SumoLogic as our log aggregator.
Why do we like log aggregators? For one, we have thousands of nodes to follow, and gaining trending insight from logs is important for analysis and maintaining the health of our complex system. Many of our employees do not have direct access to logs. In fact, one of the top users of SumoLogic is our customer support team. It allows us to give the pleasure of beautiful logs to more than just operations and development.
Not only does SumoLogic enable our Technical Operations teams to perform rapid analysis and developers the ability to monitor and troubleshoot, but it also gives us critical real-time views of our systems and alerts us when things go wrong.
This is How We Do
Collectors and aggregation up close
From a user perspective, SumoLogic comes in two parts: a Collector local to your hosts and the main UI where searches and configurations are done.
At OpenX, each Collector serves as a central syslog server, and we employ a single Collector in each of our physical datacenters. In addition, some of our internal IS services have their own Collectors. Although proxy support is now provided in the Collector configuration and should allow individual nodes to emit to Sumo, we still prefer a single Collector in each of our datacenters for ease of managing thousands of instances. One word of caution: it is important to make sure you assign enough heap memory to the Collector (a Java process) to account for the amount of logs it funnels. Early on we learned that lesson the hard way.
Every host we operate has a rsyslog configuration that uses a specific syslog facility to forward various types of logs to the SumoLogic Collectors. One advantage to using rsyslog is its ability to do “file tailing.” This allows us to send any iteratively updated file to Sumo, while retaining the ability to send directly through traditional syslog facilities. For instance, we send both network device and application logs through local4, but /var/log/messages through local2. If an application can send directly to syslog and be configured with a syslog facility, we’ll use that instead of the rsyslog file tailing. Another great feature of rsyslog is its ability to spool logs - with a configurable size - if the Collector is slow or unavailable.
In our case, different syslog facilities are identified in each Collector by the SumoLogic concept of a source. In addition to user-defined application logs, every host also sends critical Linux OS logs by default, which are classified as different sources. Furthermore, SumoLogic provides configurable user roles, which allow things like limiting regular users to only being able to search application logs, while only sysadmins have access to categories like sysinfo (/var/log/messages) and authpriv (/var/log/secure).
Although rsyslog can do its own log filtering, each Collector also has the ability to filter logs at the Collector itself, meaning loglines matching the filter never get sent out of the Collector to SumoLogic servers. This is a great way to help curtail unnecessary loglines from eating up your licensed data volume cap. We require our users to identify their volume per hour and consult with SRE before enabling log emission to Sumo.
Our Users
We use Ping Identity for many services, including SumoLogic. Ping will connect to your LDAP service and users can login directly with their LDAP credentials. Because SumoLogic has a limit on seats, we create individual accounts for our front-line technicians (SRE, Data Systems, Infrastructure Engineering), and team logins for over 250 software engineers and support staff. This way, teams can create alerts and be able to control them without relying on a specific employee.
All Night Long to Get Loggy
Best practices for SumoLogic searches
SumoLogic runs using a basic MapReduce philosophy and is sensitive to inefficiency. In fact, I have been the recipient of many “hey what the hell are you guys doing?” emails and participated in several calls to go over how we can make our searches more efficient. Just a few simple tricks can turn long hours of painful analysis into an information-rich party. Here are some best practices I’ve espoused to our log-searching glitterati.
Be as specific as possible
A SumoLogic search consists of two parts: identifiers (Map) and filters (Reduce). A typical search will be a set of identifiers, followed by a “pipe” symbol (“|”), which is then followed by filters. These filters then behave like a feed chain, producing one output that is then piped to the next.
Here’s what I mean. Consider the following logline from a Riak console.log entry:
<164>Nov 10 21:01:40 sourcehost-b17 ox3-api-riak_prod[17693]: [warning] <0.1656.0>@riak_kv_vnode:encode_and_put_no_sib_check:1826 Writing very large object (25598758 bytes) to <<"94ef58655625200a8cfc5b15afcd0b94ad52d590">>/<<"etl-list-lineitems">>
The identifier “ox3-api-riak_prod” is an example of a tag we configure on each Riak node for an Erlang log module called lager. This tag allows us to use it as a keyword before the first pipe, as in the following SumoLogic search:
_source=XV_rsyslog ox3-api-riak_prod "[warning]" "very large object"
There are two other keyword strings in this identifier, surrounded by quotes to capture the brackets and spaces. This distinguishes them from the spaces between each identifier that indicate a logical AND. If I did not want to include a particular string, I use the term NOT, and could further classify it with an OR, and group them together with parentheses:
_source=XV_rsyslog ox3-api-riak_prod OR ("[warning]" NOT "very large object")
That’s not a very useful search, but it shows the flexibility of what you can do before that first pipe with keywords.
You’ll notice the very first identifier of that search is not a keyword, but metadata. When logs come into Sumo, there is a default set of metadata that is mined from the logline, for example _sourceHost (as a FQDN) and _source, which in our installation identifies the type of log being forwarded by the Collector (in this case, our “XV” datacenter). This is typically the very first element of any search identifier.
Now let’s look at the filters:
_source=XV_rsyslog ox3-api-riak_prod "[warning]" "very large object"
| extract field=_sourceHost "(?<log_host>\w+\-\w+)"
| extract field=_sourceHost "\w+\.(?<log_dc>\w{2})"
| parse "] *" as log_full
| extract field=log_full "\@\S+\s(?<notification>.*)"
| extract field=notification "\((?<large_bytes>\d+) bytes\) to <<\"(?<large_bucket>\S+)\">>\/<<\"(?<large_key>\S+)\">>"
| toLong(large_bytes)
| count by large_bytes,large_key | sort by large_bytes
The “extract field” indicators are regex patterns that work on the contents of that field. Notice I’m actually using metadata - not the search results - as the field used to extract these values. Next, it is useful for us to classify hosts in their particular datacenter, which is embedded in that hostname. This is followed by a parse statement that requires only “bookmarks” and an asterisk to identify the value. More regex extractions are then used against specific terms I’ve defined above. Finally, SumoLogic does not know the difference between a word string and a number, so numbers must be typed if they’re to be used in mathematical formulae or sorting, as we’re doing here.
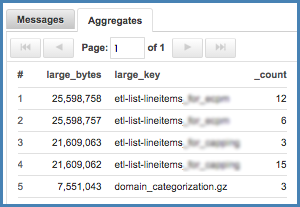
The end result is a report of large object writes in Riak, which is something we want to avoid, and is only reported in logs:
Narrow search time range when possible
This may seem obvious, but many folks miss it, and then complain that “SumoLogic is soooooo slow!” It’s simple: the longer your time range, the more data your search will scan. If you haven’t refined your search, use a shorter time range until you have your keywords, metadata, and filters well defined. In some cases this may mean selecting a time range in the past to capture the event you want. Manually entering a date range into the search parameters can be cumbersome, but worth it. I look forward to when SumoLogic provides a “visual calendar” method of entry for time ranges. Otherwise, the time span drop-down menu can be used, or utilize shorthand values like -5m, -8h, -12d, etc.
Field Extraction Rules
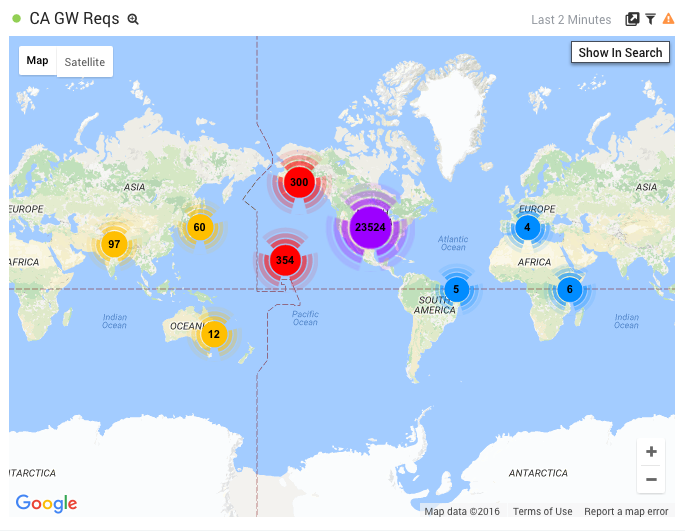
These are used to create your own metadata. They are written just like any normal search, but as the matching loglines are fed into Sumo, the metadata is automatically indexed and attached to the log message. This provides both a significant performance benefit as well as simplified search syntax. For example, here I use Field Extraction to parse an IP address from our webserver logs as endpoint_ip, and then use it in a query to geo-locate that endpoint:
_index=CA_Services ox3-http-gateway
| lookup latitude, longitude, country_code, country_name, region, city, postal_code, area_code, metro_code from geo://default on ip = endpoint_ip
| count by latitude, longitude, country_code, country_name, region, city, postal_code, area_code, metro_code
| sort _count
This utilizes Sumo’s internal geolocation function to provide a map of results:
Partitions
In the example above I used a metadata term called _index. If you have a set of logs that can be identified with metadata like _source or _sourceCategory and represent anywhere from 5-20% of your log volume, you might benefit from using Partitions. These are basically buckets of logs that are indexed together. Using _source=CA_rsyslog will still attempt to search all logs for their source, while using _index=CA_Services will only search the bucket containing logs associated with that search (which is basically _source=CA_rsyslog). Using Partitions means you’re only searching over that specific bucket of data, providing much better performance, especially in a very large installation like ours.
Avoid Where
This is another non-obvious point of efficiency. A lot of programming languages utilize conditional statements to classify and filter data. SumoLogic provides many of these functions, including where.
If you’re doing mathematical calculation within your filters, then where can be used effectively. However, if you’re using where to identify strings in your log messages, it is incredibly more efficient to simply use that string in the identifier before the first pipe. Think of it as narrowing the Map phase so the Reduce phase has less work to do.
Aggregates and Cache
Let’s look at the final line of my search:
| count by large_bytes,large_key | sort by large_bytes
This combination represents an Aggregation in Sumo. There is a specific set of filter terms that mean “aggregate”, and count by is one of the most common. Here, we’re counting first the large_bytes value with the large_key reported afterwards, then sorting by large_bytes.
Running a search with a large amount of results will cause SumoLogic to automatically “pause” your search because of the resources required to fulfill it. You will only get up to 100,000 results before a pause if there is no aggregation being done, which is the limit of Sumo’s cache for search result content. This could happen if you do something like an identifier-only (i.e. no pipe) search.
If an aggregate is used, SumoLogic will count and display all the matching search results, but only load the first 100,000 of search content into the cache. This is especially useful for very large sets of data, or data over a very large span of time, both encountered often when dealing with the huge set of log data we have at OpenX. This cache is persistent: if you perform this exact search again, you will see the contents of the cache.
Get a Move On
Making the most out of your results
After you’ve got some good log searching going, I encourage you to move to the next level: build and publish dashboards to share with other users and set up Scheduled Searches for alerting. Other tools like Live Tail and the extensive SumoLogic help will make your log analysis that much more awesome.
Dashboards
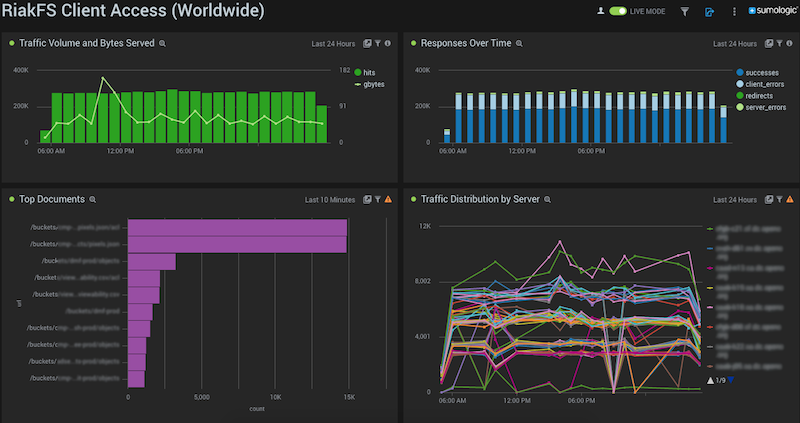
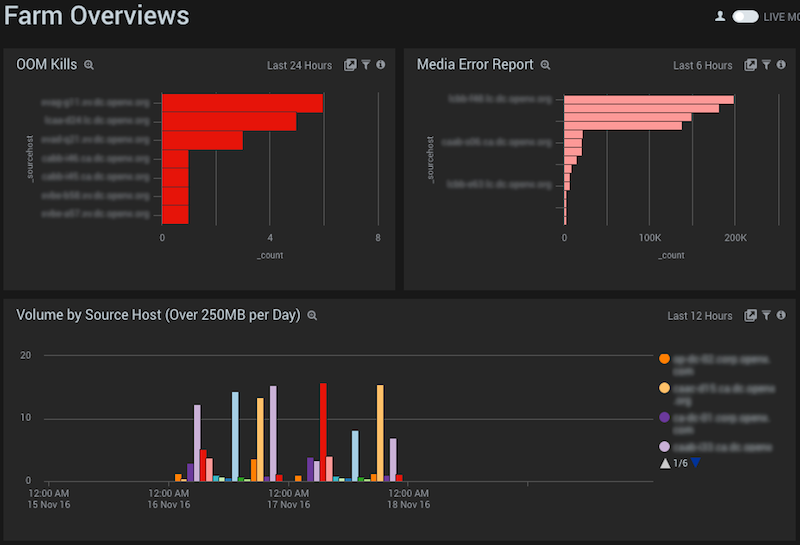
There are many operational dashboards used by Data Systems and SRE, as well as Engineering teams like API and Mobile. Shown below are just two: RiakFS usage (running on Basho’s Riak-S2) and Farm Overviews. These collect different kinds of searches on different kinds of logs into one unified dashboard, and each panel can be set to its own time range (sometimes necessary depending on the number of search results). Additionally, only searches completed with an Aggregate can be added as a Dashboard panel.
Here we see data collected from weblogs in RiakFS showing traffic volume, return codes, top documents, and traffic distribution:
Here we see specialized views of our individual hosts datacenter-wide, including log volume (important for tracking our SumoLogic usage and identifying bad actors) and items tracked in /var/log/messages:
At OpenX we have several large flat screen monitors mounted on the wall directly in front of TechOps, mostly filled by Grafana graphs of our various network, data and delivery systems. We have been trying out a Chrome plugin called Auto Refresh to keep SumoLogic dashboards displayed persistently without automatically logging out the user, showing the most relevant realtime information we need.
Scheduled Searches (aka Alerting)
Any search can be run on a schedule and emailed as alerts to whatever alerting system you employ. We could alert on the large object search above at any time interval and within any timeframe. You may want to alert every minute based on the past minute, or every hour based on the past fifteen minutes. Equality and inequality conditions can be defined, say if a particular search matches more than 5 times in a single hour, or less than 10 per minute, or equal to 0 (helpful if the absence of logs is a bad thing, which we use often). As I mentioned above, we have team logins where such scheduled searches are configured so that any member of the team can login to the account and modify or disable whatever search is in question.
Offline Use
Search results can be downloaded and saved as CSV for further processing. I use this often to associate hostnames with their assigned roles in our centralized host management system. This feature has also been useful when logs on the host have been rotated and removed, no longer containing the relevant loglines that a vendor’s customer support may want to inspect.
Realtime Live Tail
Here’s a command line tool I’ve found very useful to monitor individual hosts when needed. Below I’m tailing another Riak console.log, not in the Live Tail feature of the UI, but in zsh on my laptop. Another great example of how we can make logs available to users without root.
<<< 23:41.09 Tue Sep/13/16|~
>>> livetail "_source=rsyslog_UDP _sourcehost=sourcehost-d16"
### Authenticating ###
### Starting Live Tail session ###
<166>Sep 14 06:41:21 sourcehost-d16 riak-adquality_prod[28062]: [info] <0.1826.3555> Checking and cleaning out riak_kv_get_fsm_sup's children.
Check this out at: https://github.com/sumologic/livetail-cli
SumoLogic Status and Help
Any SaaS provider would be remiss in not including a status page. SumoLogic provides a status page as well as email alerting at: http://status.sumologic.com. If your logs suddenly disappear, this is a good place to start.
The online help is great and has improved a lot since we first began using it, including clear documentation of the commands available for your search queries: https://help.sumologic.com.
At OpenX we also have an internal wiki that details many of these recommendations with examples, as well as how developers can set up their own applications to emit to Sumo. Having a single place your engineers can go to read documentation on how to build or troubleshoot logging systems will help them understand how awesome logs can be.
So why not just use ELK?
I get this question a lot. When I first evaluated SumoLogic for OpenX, we had no log aggregation solution at all, so I went through a fairly rigorous comparison. I built an ELK (ElasticSearch/Logstash/Kibana) stack, played through some scenarios, and evaluated hardware and operational costs, not to mention support effort for the entire OpenX team. At the same time, I demoed SumoLogic. Even then, SumoLogic proved to be the much simpler solution that greatly outweighed the cost of operating our own ELK stack in every datacenter, and provide full aggregates across all of them. This may not hold true for smaller companies in the cloud, but for our scale and distributed nature it works perfectly.
At first, people were slow to adopt, not understanding some of these best practices and how to get the most out of the tool. Now, everyone at OpenX who has the need to analyze and visualize logs loves SumoLogic. The operational weight to TechOps is low, and we’re not even taking advantage of a lot of the automation we could accomplish through the SumoLogic API.
There is Awesome in Logs
This is the tip of the iceberg of how we use SumoLogic here at OpenX. I have not covered a lot of other cool topics like anomaly detection, script actions, displaying by timeslice, or the new “Unified Logs and Metrics” (ULM) feature that allows the ingestion of metrics (e.g. CPU load, IO, memory) to enable direct correlation with log activity. Nor have I covered the cornucopia of customized Applications (searches plus dashboards) for things like Apache, Linux, Active Directory, Docker, AWS, MySQL and so on.
Put simply, SumoLogic has saved our butts multiple times by helping us illuminate system behavior and pinpoint issues quickly. It is an indispensable tool for the people at OpenX to continue being unreasonably awesome at building and operating a top-rated technology stack.
Happy Logging!